
Thank you! Your submission has been received!
Oops! Something went wrong while submitting the form.
October 23, 2025
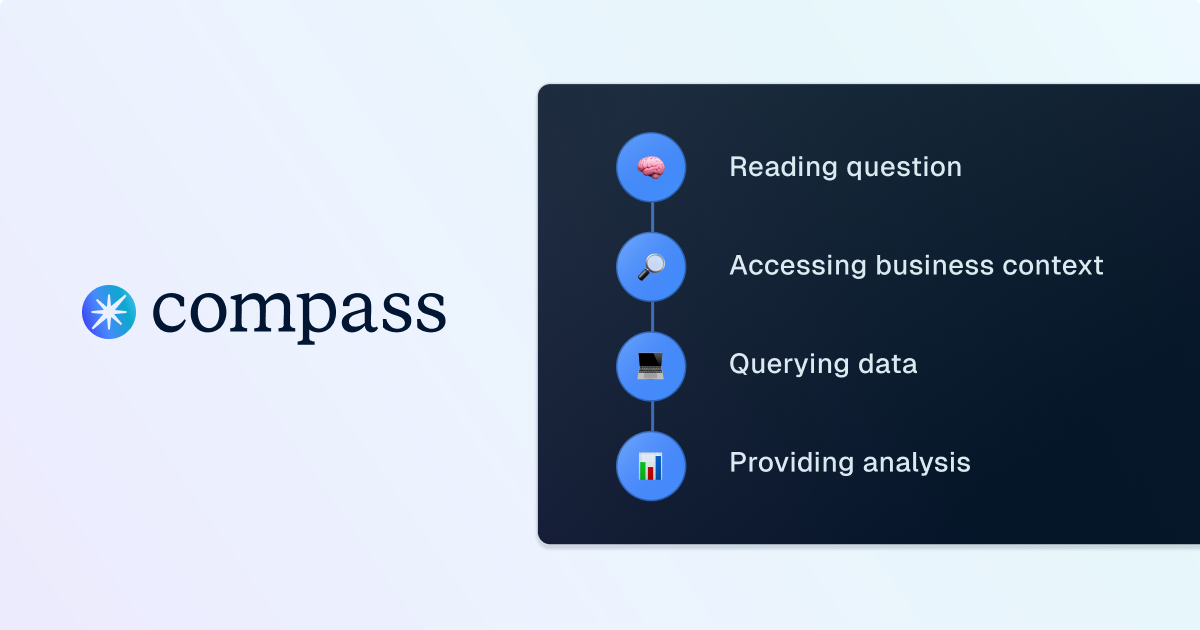
How Compass Turns Questions Into Queries
Go behind the scenes of Compass, Dagster’s analyst copilot, to see how it transforms plain-language questions into precise, optimized SQL queries. Learn how each step of the query-generation process helps analysts move faster and stay focused on insights.

Product


September 10, 2025
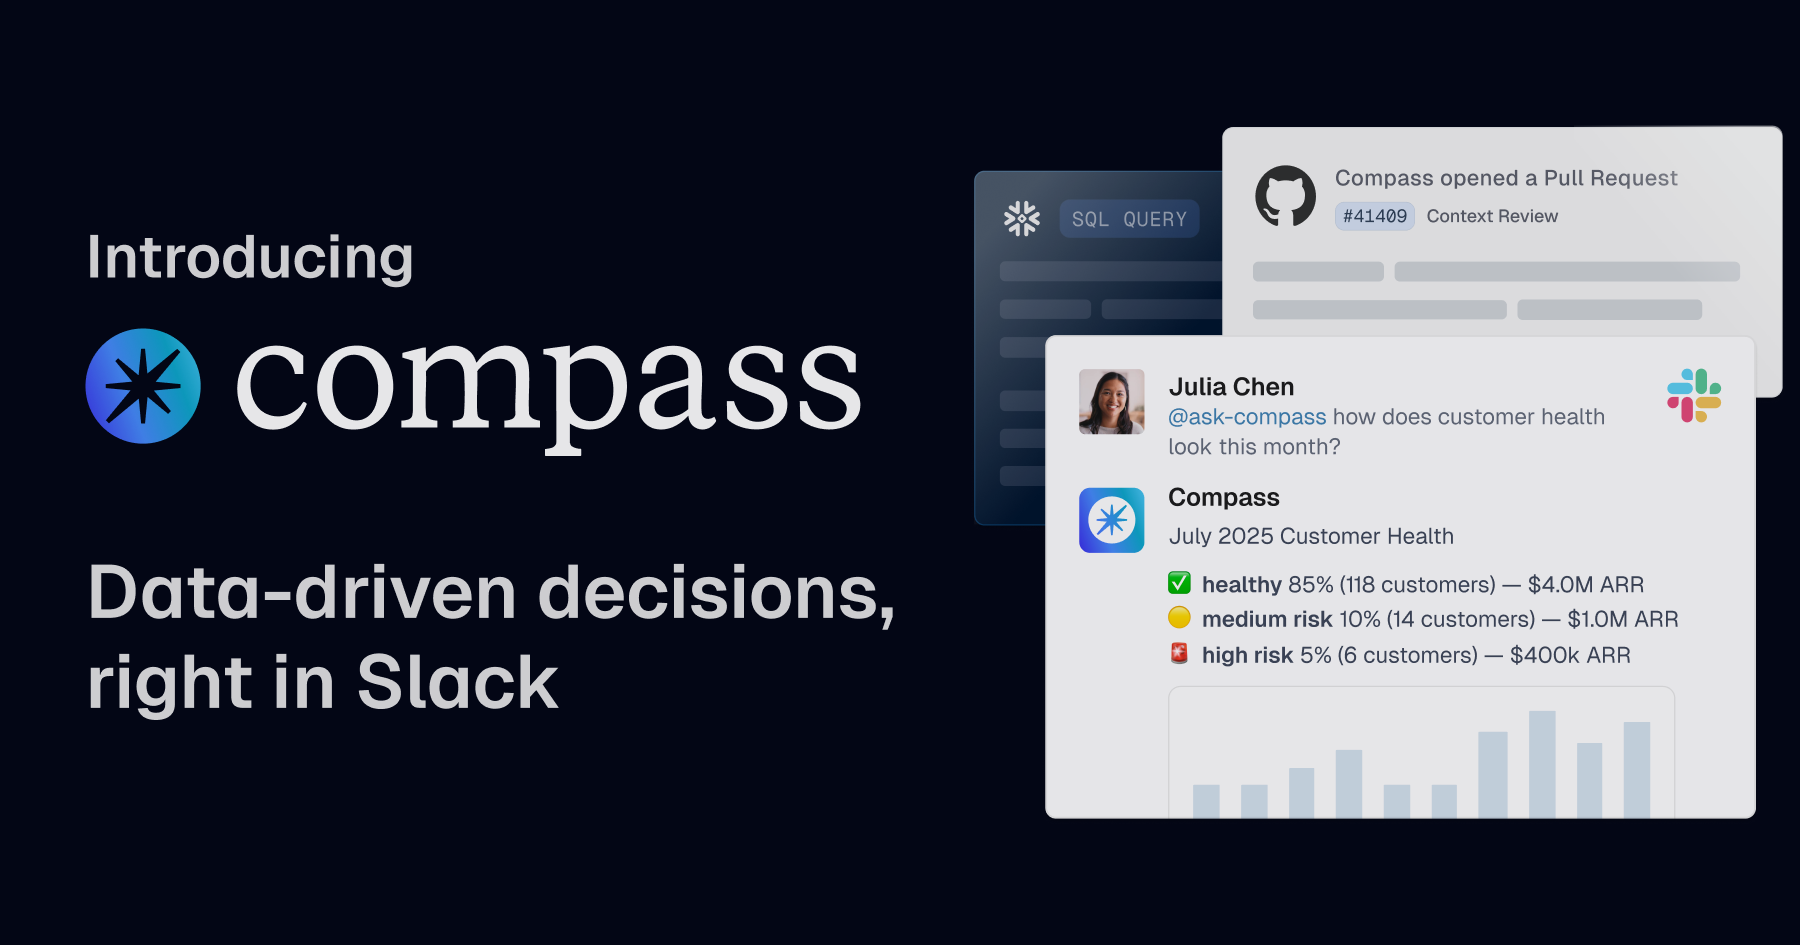
Introducing Compass: Data-driven decisions right in Slack
Converse with your company's data right in Dagster. Compass moves beyond static dashboards by enabling a natural language, two-way conversation with your data. This allows anyone to ask follow-up questions, incorporate their own business context, and achieve true data fluency without writing a single line of SQL.

Product


Dagster Newsletter
Get updates delivered to your inbox